Related Articles
UK Butterfly Recorders' Meeting 2026
29th April 2026
The Butterfly Situation in Eccleshall, Staffordshire
27th October 2026
Putting Telford's Butterflies and Day-Flying Moths on the Map
27th October 2026
More than a Feeling
David Shearan, our website administrator, explains how he has been processing data from iRecord to show the status of butterfly species in the West Midlands. This means that the information we show for each species is as up-to-date as possible and will continue to evolve as recorders submit more sightings.
Note: Be aware that the website currently uses the raw data. It does not yet apply indices or other analytical strategies to counter the effect of sampling effort bias (spikes in data caused by increases in the number of recorders, and recordings at species hotspots).
The journey of a sighting
If you take part in butterfly surveys or submit sightings via the iRecord app or website then your observations will contribute towards our statistics. This is done by so many of you that our database contained over 750,000 records by October 2026, with almost 70,000 records submitted in each of the years 2025 and 2026, and there are now more than 2,500 people submitting these records.
All of these observations go initially into the iRecord database. They arrive on our website via a regular and frequent process that downloads the West Midlands data from iRecord and uploads into the WM-BAMS database. This means that when you look at the statistics on our website they are as up-to-date as the most recent download/upload process.
Note: All sightings submitted to iRecord are verified by people in each county. If that hasn't happened when the upload takes place then any unverified records will be ignored.
The highs and lows
It would have been difficult to miss how well two of our migrant species fared in 2026 – the Painted Lady and the Clouded Yellow. If you follow any butterfly groups on social media then their success would have been obvious, not just in the West Midlands but across the country, but hopefully most of you actually saw these species in numbers in your local area.
The question is 'Do the statistics support what we all saw and felt?' The answer is a resounding yes: just take a look at the following two charts.
Painted Lady
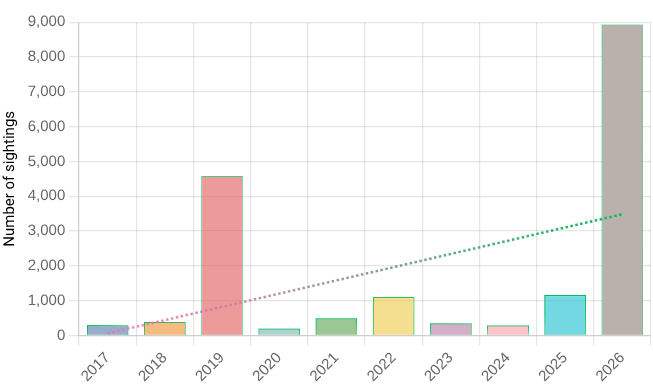 The numbers clearly demonstrate what a good year the Painted Lady had in our region. Around 9,000 sightings which was almost twice the best previous year in 2019.
Clouded Yellow
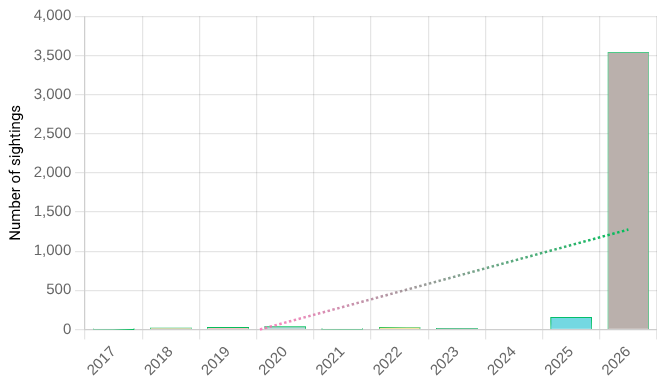 2026 wasn't just a good year for Clouded Yellow, it was outstanding with over 3,500 sightings as compared to 2025 when there were just over 150.
What about other species? I don't remember seeing comments about the Small White but I felt this was another species that I was seeing in large numbers. So I took a look at the record on our website and this is what I found.
Small White
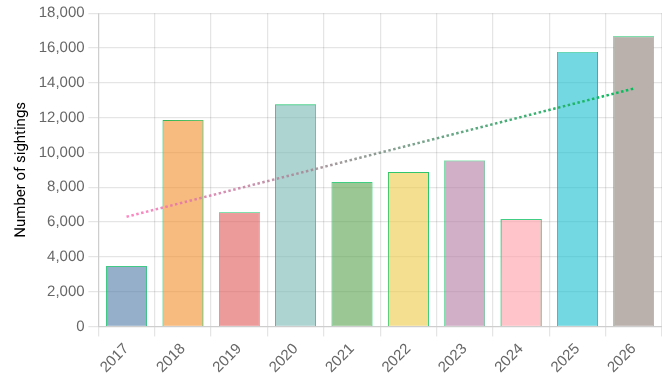
Did you notice any species that appeared to be having a poor year? I remember seeing a post from someone who reckoned there were fewer Speckled Wood around. That made me think about the transect where I help with a butterfly survey and my findings there seemed to support that. Here is the trend chart for this species which supports the general view somewhat.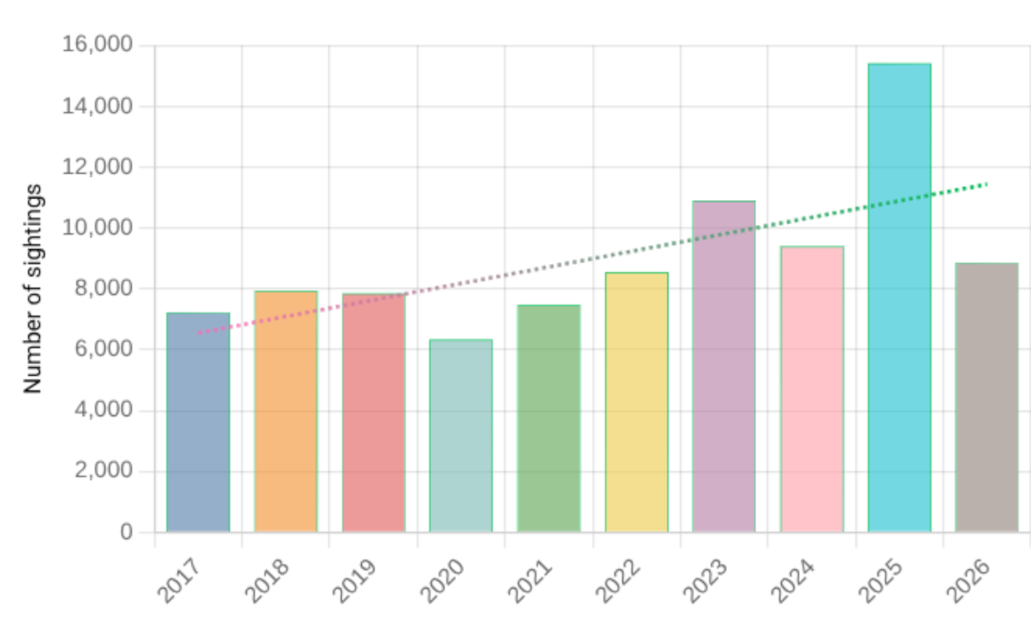 This time the data does not quite match the anecdotal evidence. Yes numbers were down on last year (around 6,000 fewer) but over the longer term there does not appear to be a decline. Perhaps it was the significant increase in 2025 that led us to believe the numbers were lower than usual this year?
Mapping the shift – distribution changes
We can also use the data to demonstrate how the distribution of certain species has been changing. Mike Williams has been reporting on the fortunes of the Brown Hairstreak for some time and in particular the successes that the Streakers team, led by the species champion Simon Primrose, has had in finding new sites for Brown Hairstreak eggs (see Simon's article 'The rise and rise of the Brown Hairstreak butterfly'). The following three maps show how the distribution has changed from 2006 to 2016 to 2026.
2006
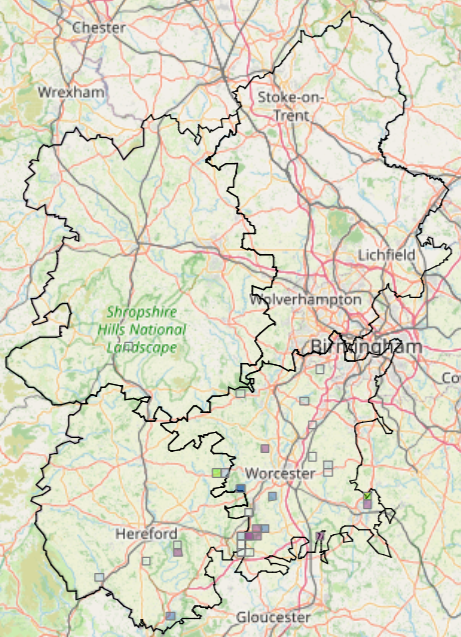
2016
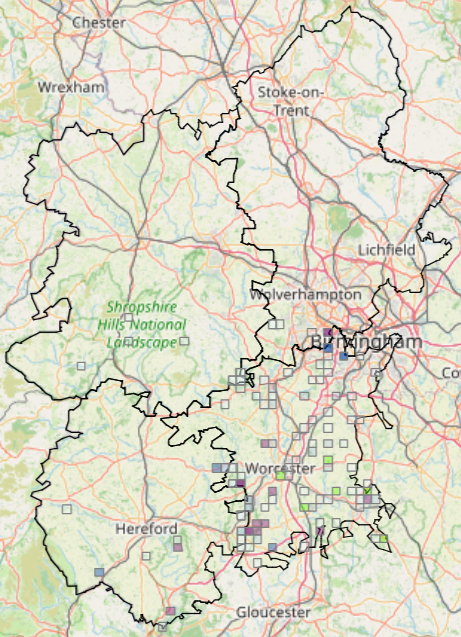
2026
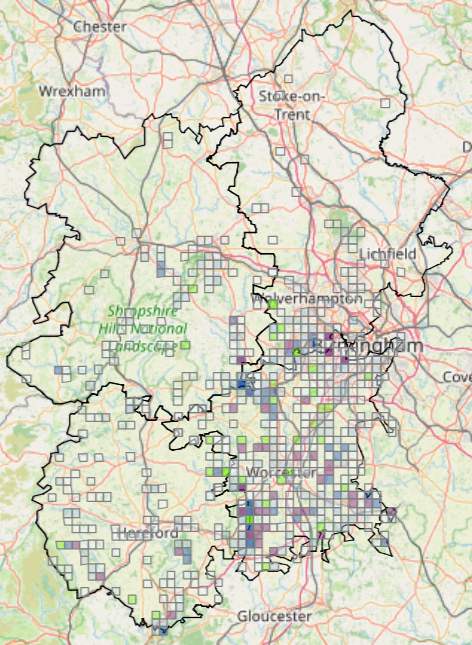
Another species has been steadily moving north and west in the region, to the delight of those of us in Shropshire and Staffordshire. That species is the Marbled White and its progress can be clearly seen in the following maps, again using 2006, 2016 and 2026.
2006
2016
2026
Shifting flight times and extra generations
2026 has been an extraordinary year for our weather, for humans and for the natural world. Climate change appears to be extending the butterfly season for some of our species or simply shifting the flight times earlier. In two remarkable cases, we have seen the emergence of adults in October: Green Hairstreak and Pearl-bordered Fritillary. This was remarkable because both species are known for having a single generation, with adults flying much earlier in the year. The data shows that neither of these species have ever been recorded in October before. In fact, the latest that either species was recorded in any year was 5 August (Green Hairstreak in 1996).
Some of the shifts in flight times and in peaks are quite subtle but they are highlighted by the mismatch between the textual description on our website (as at mid-October 2026) and the reality shown in the data. The text was written ten years ago and added to our website when it was launched in 2025. In the meantime, certain species have been changing their distribution, abundance and flight times.
As an example consider the Gatekeeper. The Flight Period description on our website says 'Early July to end August with a peak in early August.' Now compare that with the following chart, which shows the number of sightings per week in each of the last ten years.
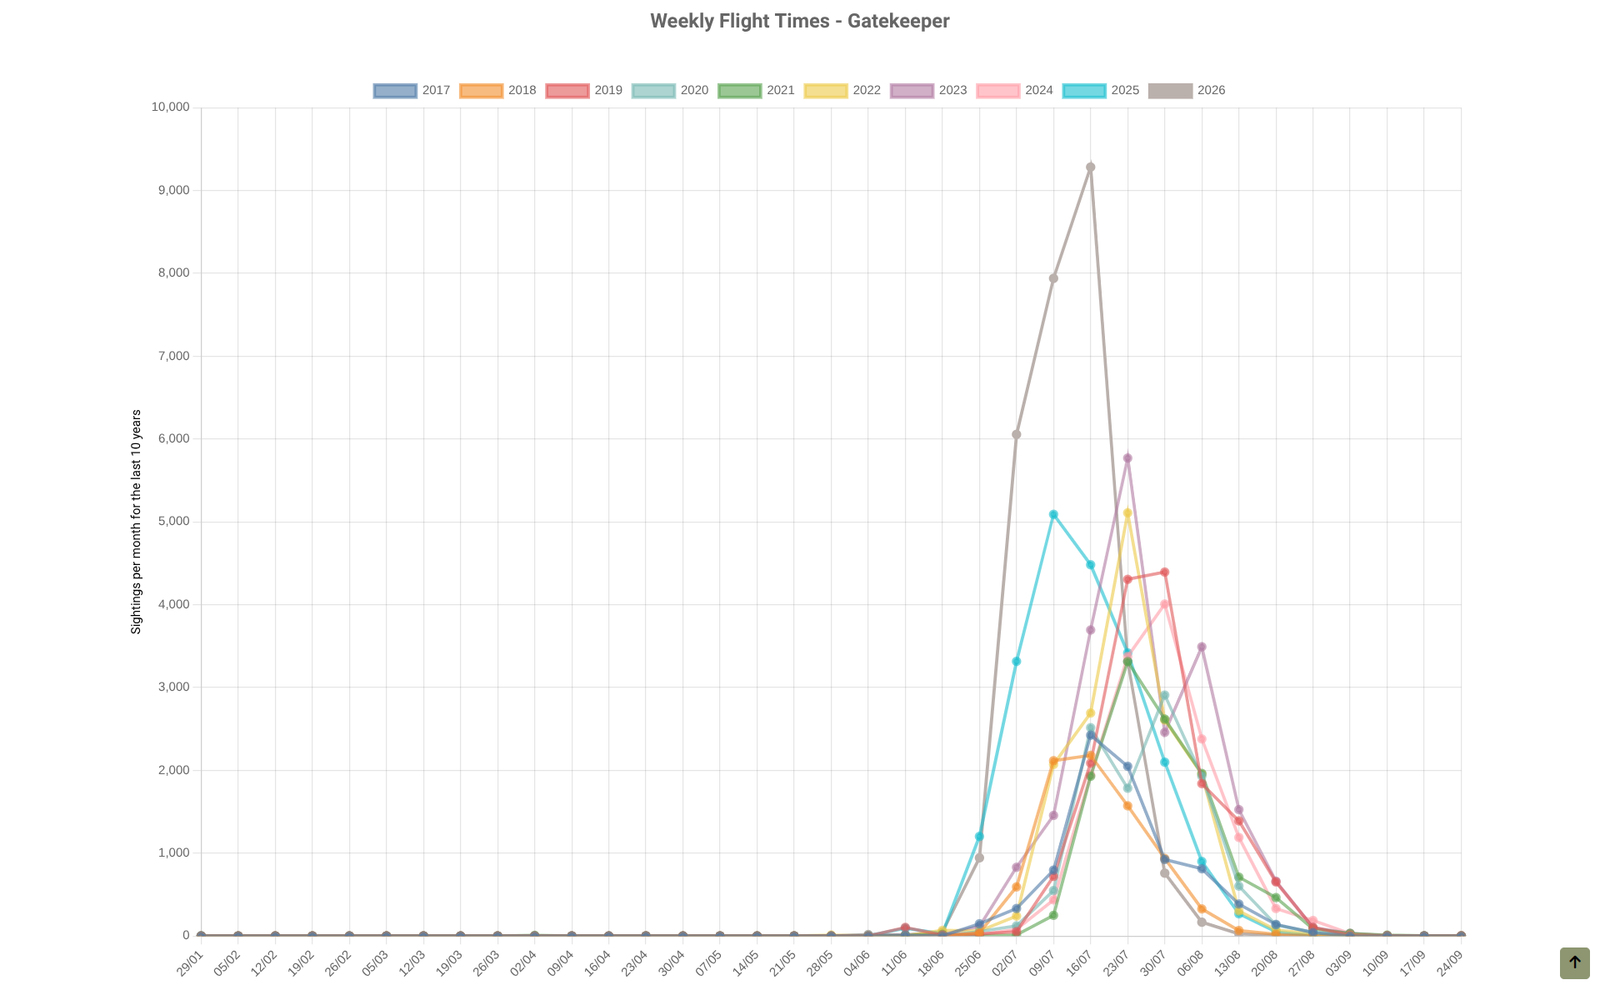 The chart shows that in most years the peak is actually in July
Note: We aim to update the text used on our species pages to make it as current as possible.
First and last sightings
Every species name is a clickable link to a chart showing the first and last sighting each year since 2000. I think the charts are quite revealing. To illustrate this, take a look at the chart for the Orange-tip.
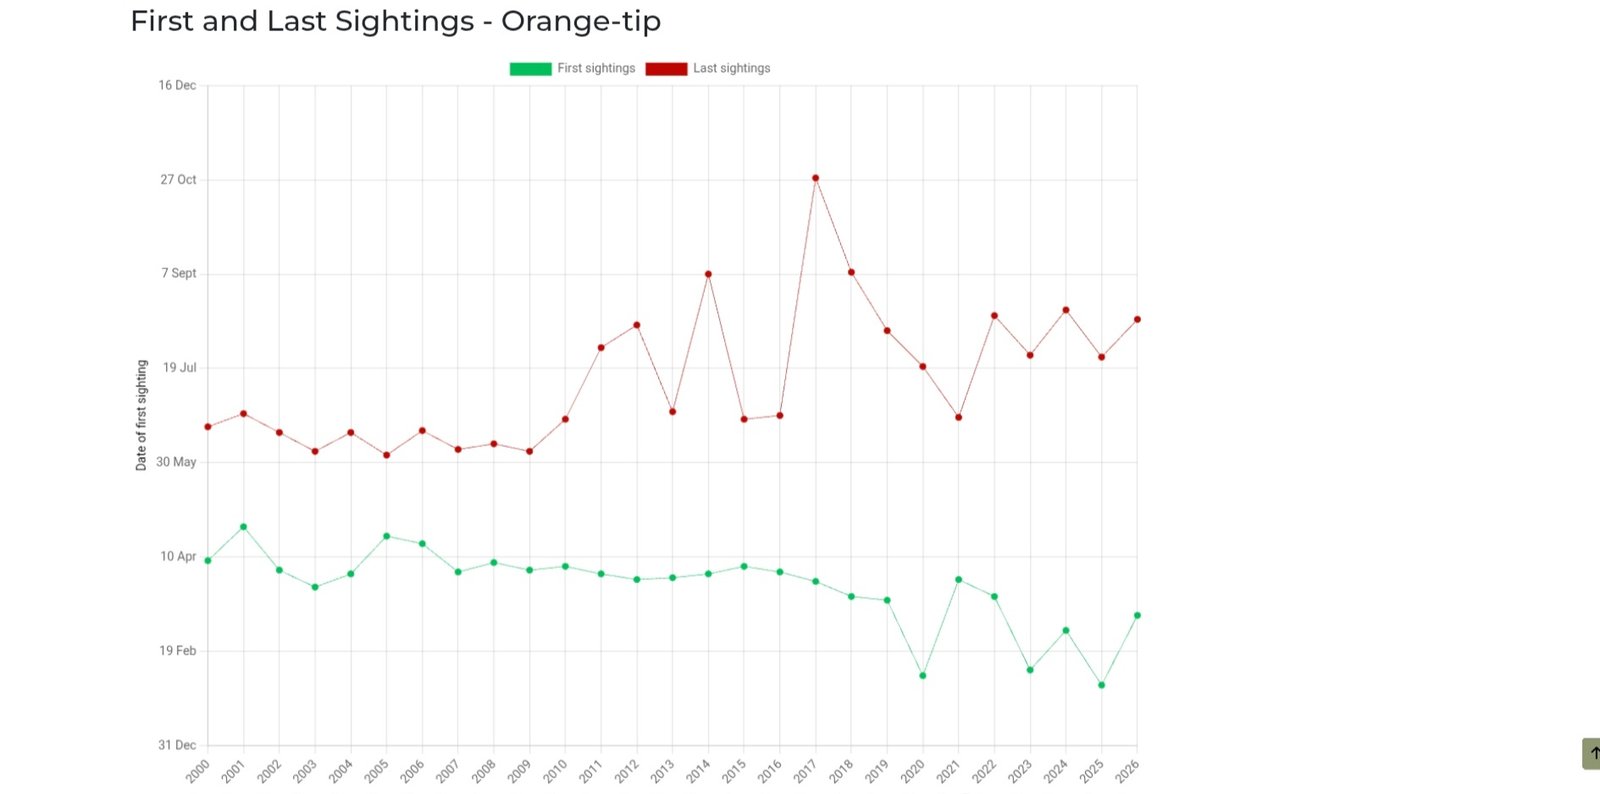 The two lines have created a funnel on the chart, narrow towards the year 2000 and wider by 2026. This appears to show the the Orange-tip is being seen earlier and later, in other words there is a longer flight period. What do you think? Does this match your own experience? Why not take a look at some of the other species?
Where does all the data come from?
The following table lists the top ten sources for our data in iRecord. It clearly demonstrates how significant the UK Butterfly Monitoring Scheme's transect programme is. For those of you who are not aware of this, it is a survey method that uses a consistent route through a site, with a visit every week from April to September, where all butterflies are recorded. If you fancy getting involved, please get in touch with us through our contact form and we will help.
| UKBMS transects | 507,851 |
| iRecord website | 74,766 |
| iRecord general data | 49,970 |
| BirdTrack non-avian taxa | 20,281 |
| iRecord Import | 18,750 |
| iNaturalist | 16,387 |
| Garden Butterfly Survey | 15,595 |
| iRecord Butterfly App | 13,562 |
| UKBMS Wider Countryside Butterfly Survey | 11,652 |
| iRecord Butterflies list survey | 8,285 |
Future features – more interaction and flexibility
I will be adding additional functionality to the website, with new features and improvements. I aim to make the charts and maps more interactive, so that you can view the data in different ways. It won't exactly be artificial intelligence but it ought to be a litle bit smart.
Hopefully these improvements will allow you to answer some of your own questions about the distribution, abundance and lifecycles of our precious butterflies.
Make your sightings count: join the big picture
Data is only as powerful as the community behind it, and every single butterfly you spot plays a vital role in tracking these historic regional shifts. The next time you see a flutter of color in your garden, a local park, or a West Midlands nature reserve, don't just note it down – log it! By submitting your sightings through iRecord, your field observations will directly feed into the charts, maps and other stats on the West Midlands Butterfly and Moth Society's website, helping us map the future of our local butterflies in real time.
Let’s keep building this picture together. Submit your latest sightings today!